仕事でARIMAモデルを使ってことあるのに、ろくにトレンドとか意識していなかったので反省を込めてメモ。
時系列のトレンドを超ざっくり言うと、時系列に長期的な変化のこと。増加傾向は年々多くの人がその対象を知るようになり、市場が拡大していることの影響とも言えます。
時系列がどのようなトレンドを持っているかを見るには、移動平均プロットがポピュラーです。
import matplotlib.pyplot as plt
import plotly.express as px
from plotly.subplots import make_subplots
import plotly.figure_factory as ff
import plotly.offline as offline
import plotly.graph_objs as go
#トレンド
#df_train6は適当。
sales = df_train6[:train.shape[0]].groupby('date').agg({"sales" : "mean"}).reset_index()
#set_index:第一引数keysにインデックスとして使用する列の列名(列ラベル)を指定する。指定した列がindexに設定される。
#https://note.nkmk.me/python-pandas-set-index/
sales.set_index('date',inplace=True)
#rolling 関数で移動平均を求める
#rolling()の基本的な使い方
#Windowの幅を指定: 引数window
#Windowの中心に結果の値を格納する: 引数center
#最小データ個数を指定: 引数min_periods
#窓関数の種類を指定: 引数win_type
#列方向に窓関数を適用: 引数axis

moving_average = sales.rolling(
    window=365,       # 365-day window
    center=True,      # puts the average at the center of the window
    min_periods=183,  # choose about half the window size
).mean()              # compute the mean (could also do median, std, min, max, ...)
moving_average['date'] = sales.index

fig = make_subplots(rows=1, cols=1, vertical_spacing=0.08,
                    subplot_titles=("Sales 365 - Day Moving Average"))
fig.add_trace(go.Scatter(x=sales.index, y=sales['sales'], mode='lines', fill='tozeroy', fillcolor='#c6ccd8',
                     marker=dict(color= '#334668'), name='365-Day Moving Average'))
fig.add_trace(go.Scatter(x=moving_average.date,y=moving_average.sales,mode='lines',name='Trend'))
fig.update_layout(height=350, bargap=0.15,
                  margin=dict(b=0,r=20,l=20),
                  title_text="Sales trend during years",
                  template="plotly_white",
                  title_font=dict(size=25, color='#8a8d93', family="Lato, sans-serif"),
                  font=dict(color='#8a8d93'),
                  hoverlabel=dict(bgcolor="#f2f2f2", font_size=13, font_family="Lato, sans-serif"),
                  showlegend=False)
fig.show()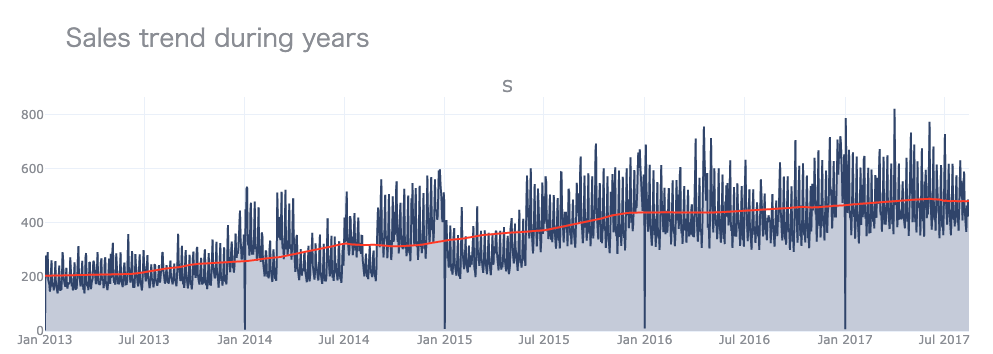
これは上昇トレンド。
参考
https://note.nkmk.me/python-pandas-rolling/